The public data layer for web3 teams
Ecosystem Signals helps web3 teams build visual systems to turn metrics into consistent, reusable content for your social presence
Staying visible in noisy timelines where attention moves fast
Inconsistent Social Content
Updates are shared sporadically, leading to inconsistent signals of your ecosystem’s health and growth.
Metrics appear in different formats, if they are posted at all
Lack of visual impact negatively affects attention in crowded timelines
No consistent structure across posts or updates
Hidden Ecosystem Metrics
The data exists, but it is hidden in dashboards and not surfaced clearly in line with your brand for the public.
Key metrics live in internal tools and dashboard analytics
Public posts lack context or clear framing of key projects metrics and successes
Ecosystem health is difficult to understand at a glance
High Manual Overhead
Creating metric-based content is great, but keeping this up-to-date requires repetitive and manual effort.
Data is pulled and re-entered manually requiring valuable time
Visuals are redesigned and reformatted for each update
Ongoing work competes with higher-value work within the team
Bespoke graphics designed around your data and cadence.
Step 01
Design the templates
We define your core metrics and design bespoke, reusable templates aligned with your brand - built to stay consistent as the numbers change.

Step 02
Data & Cadence
You share the metrics you want to signal, and how often you want updates so the system runs on a predictable rhythm.

Step 03
Asset Generation
We apply the latest data to your bespoke templates and deliver ready-to-post assets.

Starting with bespoke Figma designs, these are built in code to adapt to the latest data for visually consistent and reusable social content.


Ecosystem Signals can adapt to different Web3 projects, wherever there is evolving and repeatable data.
DeFi Protocols
DeFi teams generate rich, real-time data, but communicating it consistently in public can be difficult.
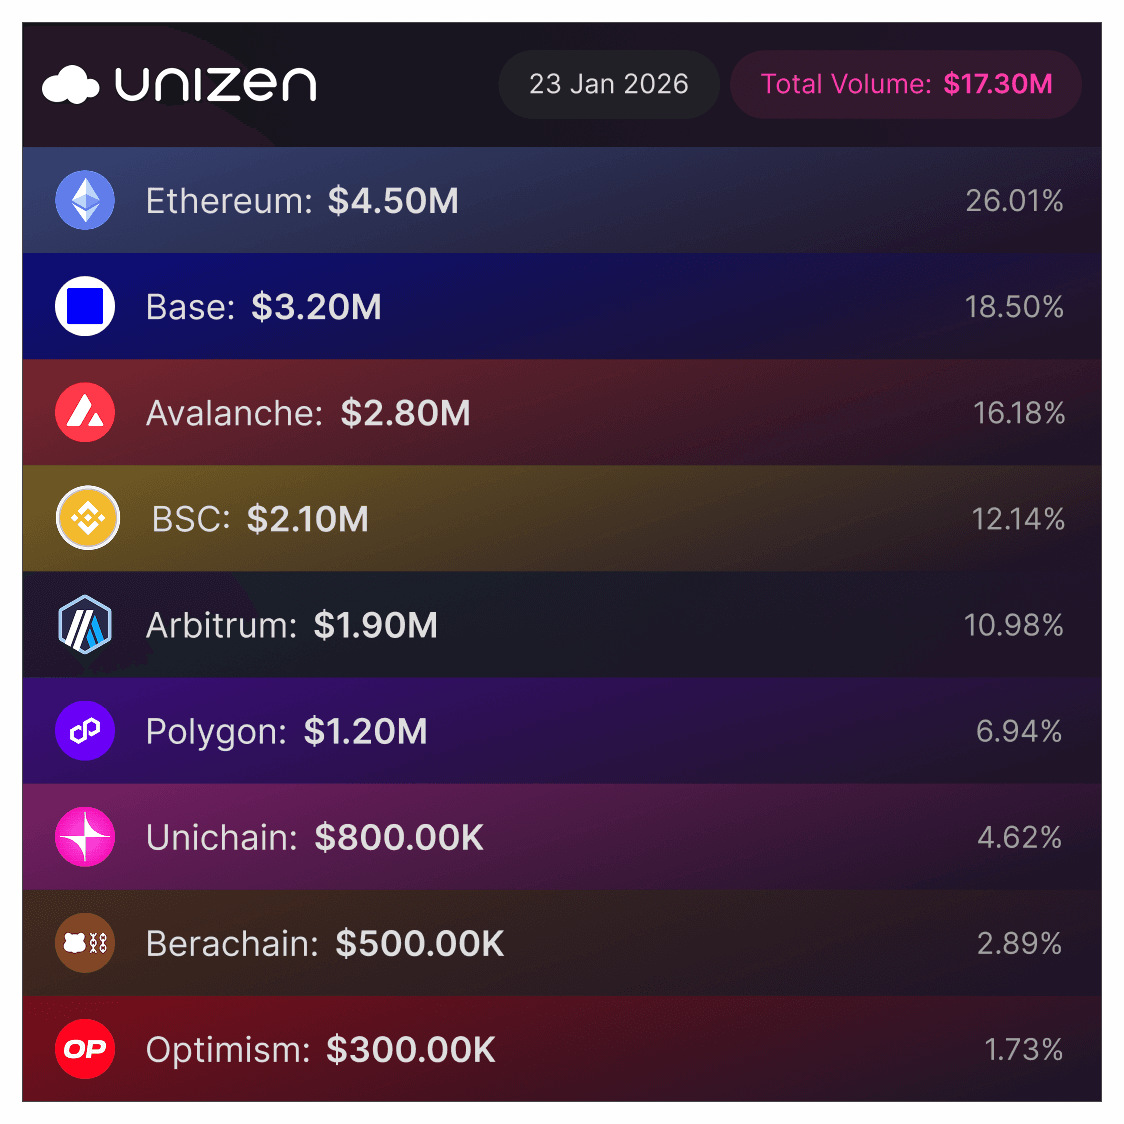
TVL, liquidity and volume over time
APY, yield distribution and utilisation rates
Market share, protocol growth and chain distribution
Infrastructure & Networks
Infrastructure and network teams are inherently data-driven, but metrics often stay private and limited to internal team members.
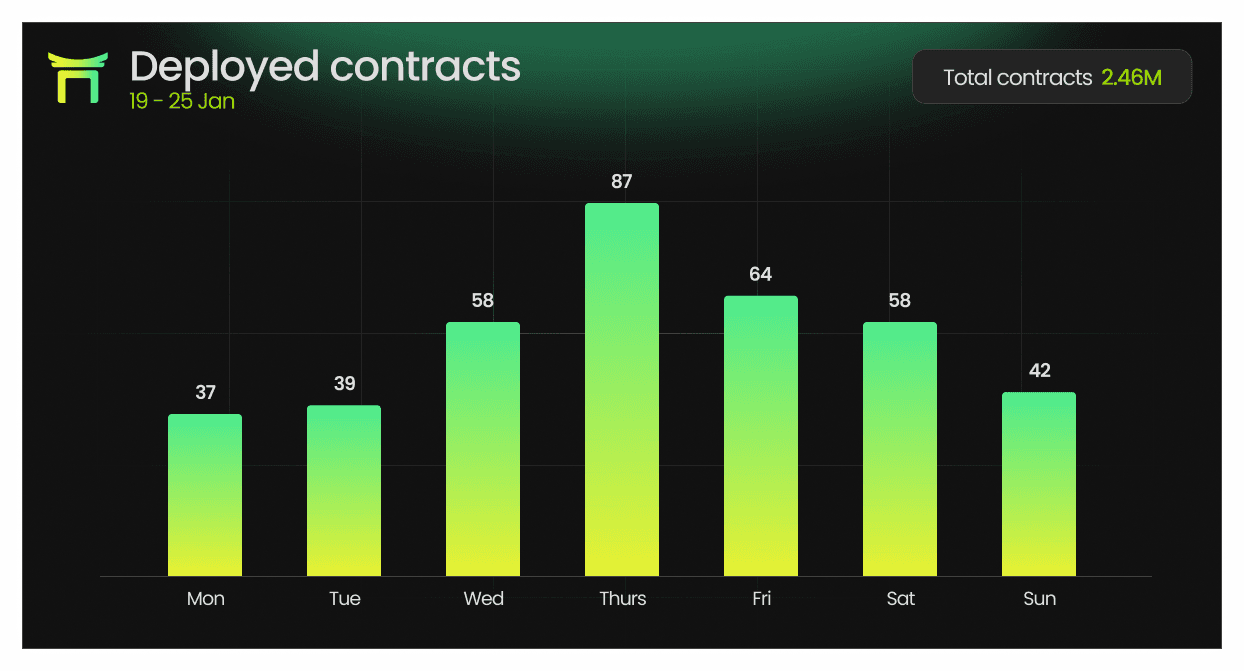
Network usage, transactions or throughput
Ecosystem growth (apps deployed, integrations, chains supported)
Performance signals such as uptime, latency, or activity trends
Memes & Trading
Trading & meme-driven platforms move quickly and publicly on social channels, but communicating changes can be infrequent.
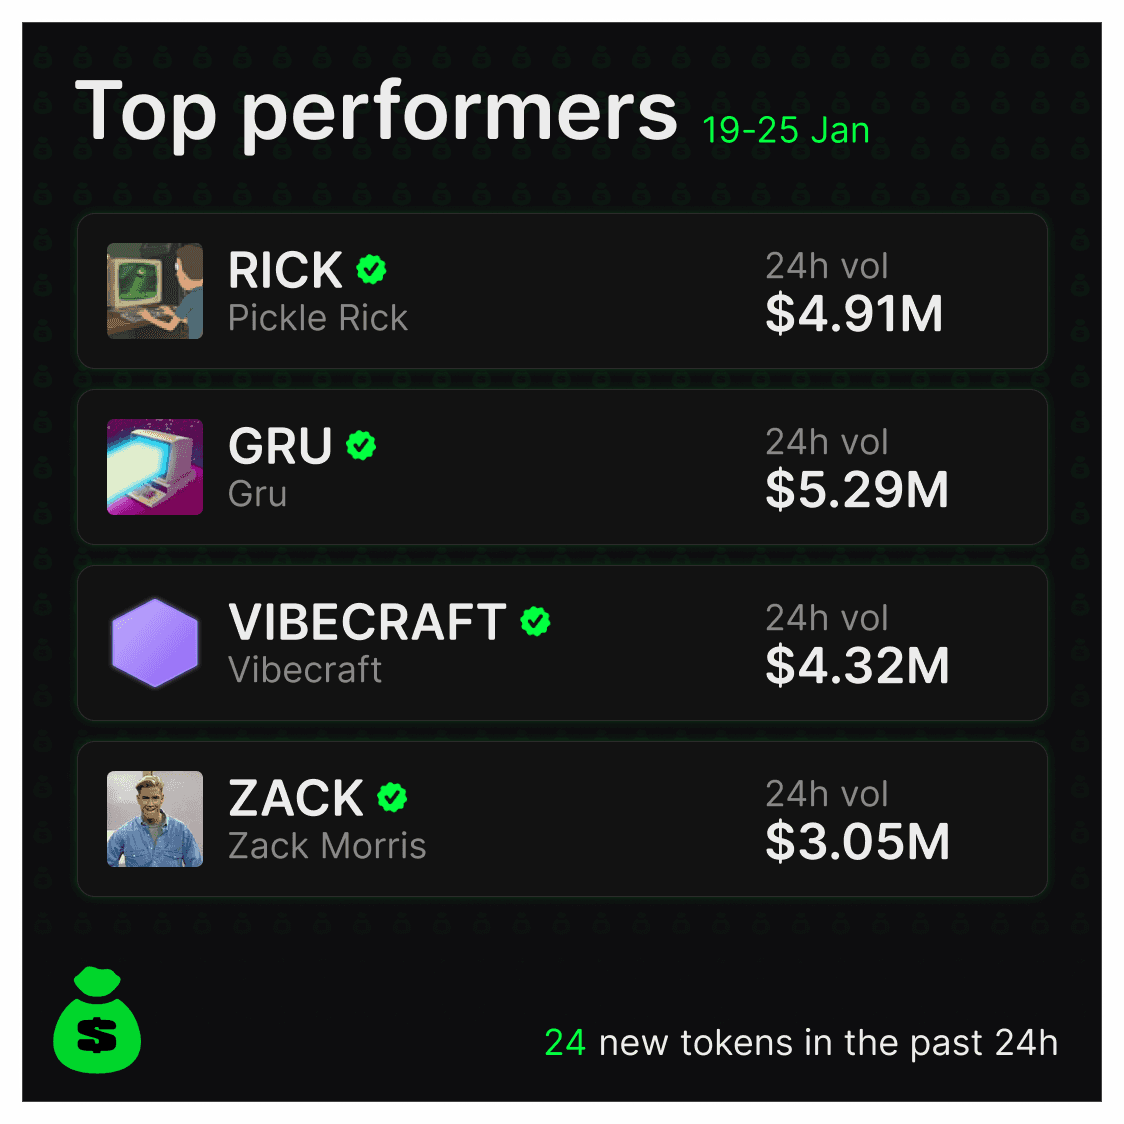
Trading volume, velocity and trend shifts
Launch activity, participation or graduation metrics
Holder growth, activity spikes or market momentum
NFTs
NFT and on-chain economy teams often struggle to show momentum beyond one-off drops.
Volume, floor price and transaction activity
Active users, creators or collections
Ecosystem growth across releases, seasons or events
Ecosystem Signals uses a two-part pricing model: System Setup to establish the foundation, and Signal Cadence to run it over time.
System Set-up
A one-time engagement to design your public data layer templates.
Pricing varies depending on the amount of templates required.
Definition of core ecosystem metrics and signals
Design of bespoke, reusable visual templates
Visual language aligned to your brand and ecosystem
Templates built to update without redesign
Signal Cadence
Ongoing operation of your public data layer on a defined rhythm.
Pricing varies depending on the frequency of assets combined with template variations.
Regular updates based on your chosen cadence
Data applied consistently across the system
Finished, ready-to-post assets for X and ecosystem channels
Light iteration as metrics evolve over time